The Average True Range (ATR) is not just another technical indicator – it’s a powerful tool that can help traders make informed decisions. Whether you’re a novice or an experienced trader, understanding ATR is essential for interpreting market volatility and setting stop-loss levels. In this comprehensive guide by 4xPip, we will decode ATR and calculate and interpret ATR, examining how it differs from other volatility indicators. Whether you’re a day trader, swing trader, or long-term investor, this guide will equip you with the knowledge and tools to harness ATR’s potential and improve your trading performance. 4xPip’s expert advisors and indicators are designed to enhance your trading experience and increase your chances of success. So why wait? Take control of your trading journey and maximize your potential with 4xPip.
What is Meant by Average True Range (ATR) in Trading?
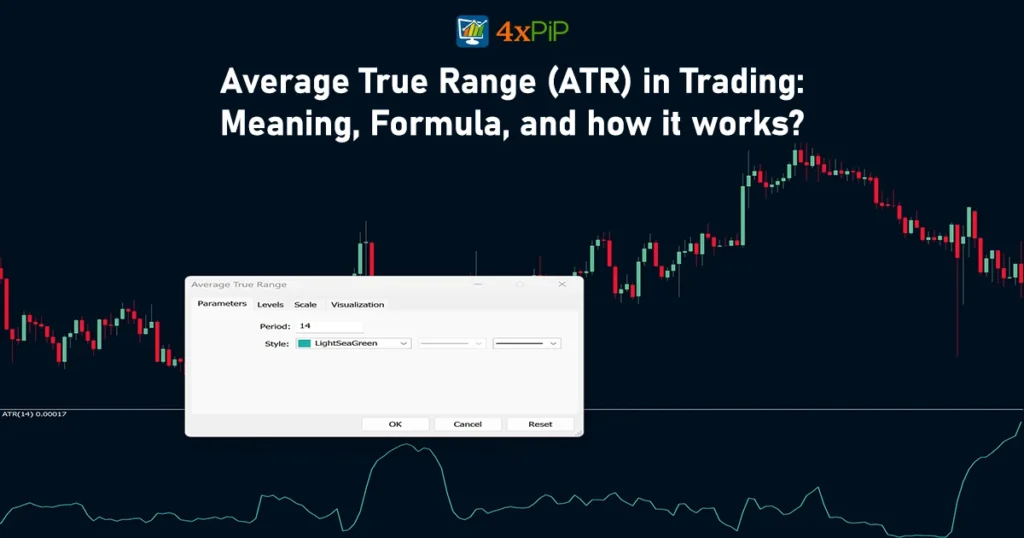
The Average True Range (ATR) is a technical indicator that measures market volatility, developed by J. Welles Wilder Jr. Volatility is a crucial aspect of the financial markets. It refers to the price fluctuation in a given asset or market. Traders need to understand volatility to make effective trading decisions and manage risk. Volatile markets offer profit opportunities, but they also carry higher risks. ATR gives traders a more accurate depiction of price movement than traditional price range measurements. ATR measures the range between high and low prices, considering gaps and volatility. This indicator gives traders insights into how much an asset or security typically moves in a given time frame, aiding risk management and position-sizing strategies. By incorporating ATR, traders can determine optimal entry and exit points, set realistic profit targets, and adjust their trading strategies to market conditions.
4xPip offers diverse indicators to help you analyze market trends and make informed trading decisions. Our indicators are customizable and can be tailored to your specific trading style and preferences. Whether you prefer oscillators, moving averages, or trend-following indicators, we have many options. Our indicators are compatible with popular trading platforms, making integrating them into your existing trading setup easy.
What is The Average True Range Formula and Calculation?
The Average True Range (ATR) is calculated using a multi-step process that involves determining the True Range (TR) for each period and then calculating the average of these True Range values over a specified time frame. Here’s the step-by-step formula for calculating the ATR:
True Range (TR):
The True Range is the maximum of the following three values:
- High minus Low: The absolute difference between the high and low prices of the period.
- The absolute value of (High minus Previous Close): The absolute difference between the high price and the previous day’s closing price.
- The absolute value of (Low minus Previous Close): The absolute difference between the low price and the previous day’s closing price.
Mathematically, TR is expressed as:
TR= max (High−Low, High−Previous Close, Low−Previous Close):
Average True Range (ATR):
Once the True Range is calculated for each period, the ATR is determined by calculating the exponential moving average (EMA) of the True Range values over a specified time period. The formula for ATR is typically represented as:
ATRn = (ATRn-1×(n-1)+TRn)/n:
Where:
- ATRn is the Average True Range for the current period (n).
- ATR(n-1)is the Average True Range for the previous period (n-1).
- TRn is the True Range for the current period (n).
- n is the specified time period (usually 14 days is common).
Calculation of Average True Range with Example:
Let’s walk through the calculation of the Average True Range (ATR) using the formula provided:
ATRn = (ATRn-1×(n-1)+TRn)/n:
Suppose we are calculating the 14-day ATR, and we have historical data for the True Range (TR) over the past few days. Let’s assume we are currently on the 15th day, and we want to calculate the ATR for this day.
Daily Values:
|
Day |
High |
Low |
Yesterday’s Close |
|
1. |
$30.50 |
$28.60 |
$29.75 |
|
2. |
$31.25 |
$30.50 |
$31.10 |
|
3. |
$30.10 |
$30.75 |
$31.80 |
|
4. |
$32.15 |
$30.90 |
$32.10 |
|
5. |
$32.00 |
$31.20 |
$32.50 |
|
6. |
$32.35 |
$31.50 |
$32.90 |
|
7. |
$32.70 |
$31.80 |
$33.25 |
|
8. |
$33.05 |
$32.10 |
$33.60 |
|
9. |
$33.40 |
$32.40 |
$33.95 |
|
10. |
$33.75 |
$32.70 |
$34.30 |
|
11. |
$34.10 |
$33.00 |
$34.65 |
|
12. |
$34.45 |
$33.30 |
$35.00 |
|
13. |
$34.80 |
$28.60 |
$29.75 |
|
14. |
$35.15 |
$30.50 |
$31.10 |
Now, let’s calculate the True Range (TR) for each day and then determine the 14-day Average True Range (ATR):
Daily True Range (TR) Calculation:
|
Day |
High−Low |
High−Previous Close |
Low−Previous Close |
|
1. |
$1.75 |
$0.70 |
($1.05) |
|
2. |
$1.35 |
$0.05 |
($0.30) |
|
3. |
$1.50 |
$0.05 |
($1.15) |
|
4. |
$1.65 |
$0.45 |
($0.60) |
|
5. |
$1.25 |
$0.45 |
($0.30) |
|
6. |
$1.45 |
$0.35 |
($0.20) |
|
7. |
$1.50 |
$0.20 |
($0.30) |
|
8. |
$1.55 |
$0.15 |
($0.40) |
|
9. |
$1.60 |
$0.05 |
($0.55) |
|
10. |
$1.65 |
$0.25 |
($0.50) |
|
11. |
$1.70 |
$0.05 |
($0.75) |
|
12. |
$1.75 |
$0.40 |
($0.60) |
|
13. |
$1.80 |
$0.75 |
($0.50) |
|
14. |
$1.85 |
$1.00 |
($0.70) |
Calculating 14-day ATR:
Sum of (H – L) column = $20.55
ATR = ($20.55 / 14) = $1.46
Therefore, this stock’s 14-day Average True Range (ATR) is approximately $1.46.
What Does The Average True Range Indicate?
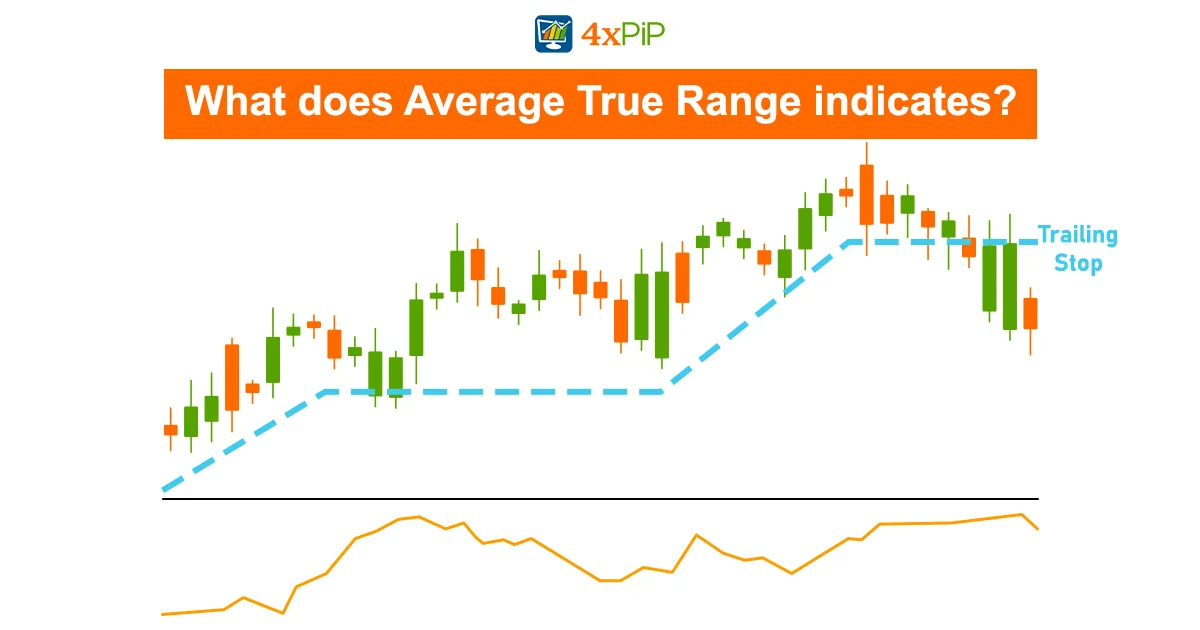
The Average True Range (ATR) is a technical analysis indicator that provides insights into the volatility of a financial instrument, such as a stock, currency pair, or commodity. It indicates the average range between high and low prices over a specified period, offering traders valuable information. Here’s what the Average True Range indicates:
- The Average True Range (ATR) is a valuable tool for assessing the volatility of a financial instrument. Elevated ATR values indicate significant price swings and heightened market volatility, suggesting a period of dynamic and potentially unpredictable movements. Conversely, lower ATR values signal stability, with minor price fluctuations and a market environment characterized by reduced volatility.
- ATR plays a crucial role in helping traders establish optimal stop-loss levels. By adopting these levels based on the current ATR values, traders can align their risk mitigation strategies with the prevailing market conditions.
- Traders utilize ATR to identify potential entry and exit points in the market. The adaptability of strategies based on ATR values ensures that traders can align their actions with the current level of volatility. This strategic adjustment enhances the precision of entry and exit decisions, offering traders a more nuanced understanding of the market dynamics.
- Higher ATR values suggest a greater likelihood of substantial price movements, indicating a possible breakout in the market. Traders can leverage this insight to position themselves strategically during heightened volatility.
How Do You Use The (ATR) Average True Range?
ATR (Average True Range) is a versatile tool for traders, but how you use it depends on your goals and trading style. Here are some popular strategies:
- Setting Stop-Loss Orders:
- Multiply ATR by a factor (e.g., 2 or 3) to establish a buffer zone based on average volatility.
- Place your stop-loss order beyond this buffer to protect yourself from unexpected large swings.
- Identifying Entry and Exit Points:
- Breakouts: A sudden spike in ATR could signal a potential breakout from a trading range. This might be an opportunity to enter a long position if the price breaks above resistance or a short position below support.
- Consolidation: A sustained low ATR could indicate a market consolidation phase. This might be a good time to exit and wait for more precise directions before re-entering.
- Gauging Trend Strength:
- While ATR doesn’t predict trends, it can help identify markets with established trends.
- A trend might be brewing when prices consistently move beyond the ATR range in one direction. This can help you confirm existing trends or identify potential trend reversals.
Average True Range (ATR) vs. Average Directional Index (ADX)
|
Feature |
Average True Range (ATR) |
Average Directional Index (ADX) |
|
Focus |
Magnitude of price movement |
Strength and direction of trend |
|
What it Tells You |
Average daily price swing |
Whether a trend is strong, weak, or absent |
|
Think of it As: |
Ruler measuring price range |
Compass showing trend direction |
|
Benefits for Traders |
Setting stop-loss orders, identifying entry/exit points, gauging trend strength |
Confirming existing trends, spotting potential reversals, filtering trading opportunities |
|
Timing |
Lagging indicator |
Can give early hints of trend changes |
Conclusion:
Average True Range (ATR) is a crucial tool for traders, unraveling market volatility and enhancing decision-making. This comprehensive guide by 4xPip not only demystifies ATR’s calculation and interpretation but emphasizes its significance in setting stop-loss levels, identifying entry/exit points, and gauging trend strength. ATR’s adaptability to various trading styles makes it indispensable for novice and experienced traders. 4xPip is your trusted guide, helping you analyze the markets with poise and precision. Join the community of successful traders and start dominating the markets today. Don’t wait; unlock your trading potential with 4xPip. Visit our website now!