In the world of trading, where every decision could be the difference between success and failure. Energetic environment like this, having the right tools and strategies is essential. That’s where the Average Directional Movement Index (ADX) comes in. With the ADX indicator, traders can identify when a trend is strong or weak, allowing them to make informed decisions about their trades. In this article, we’ll unlock the secrets of the ADX and show you how to harness its power to your advantage. 4xPip enhances this power by providing state-of-the-art automated trading solutions that execute trades based on the ADX indicator’s signals. The result? Increased accuracy and efficiency in your trading strategies. Take advantage of the potential upside of utilizing the ADX indicator with 4xpip. Get started today!
What is meant by The Trends Average Directional Movement Index (ADX) Indicator?
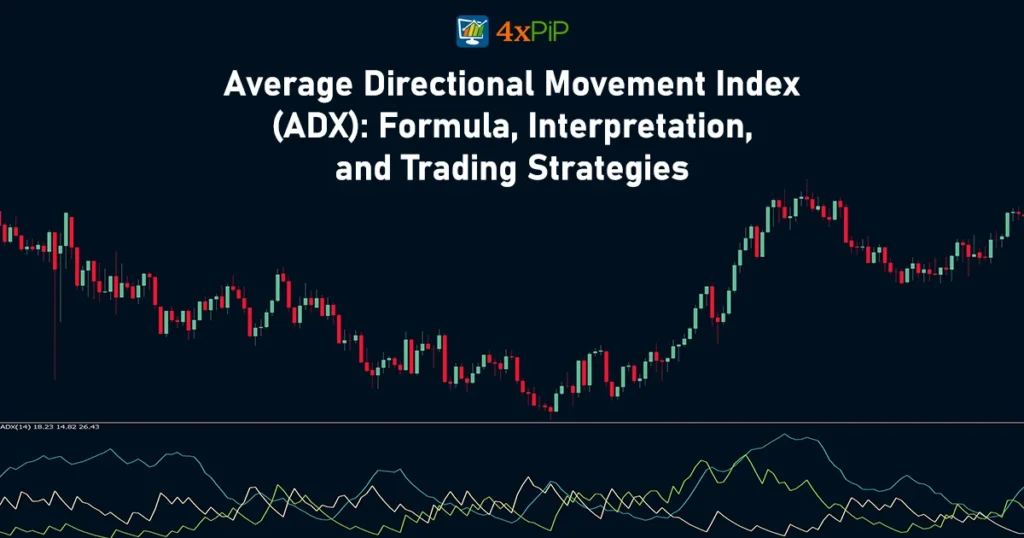
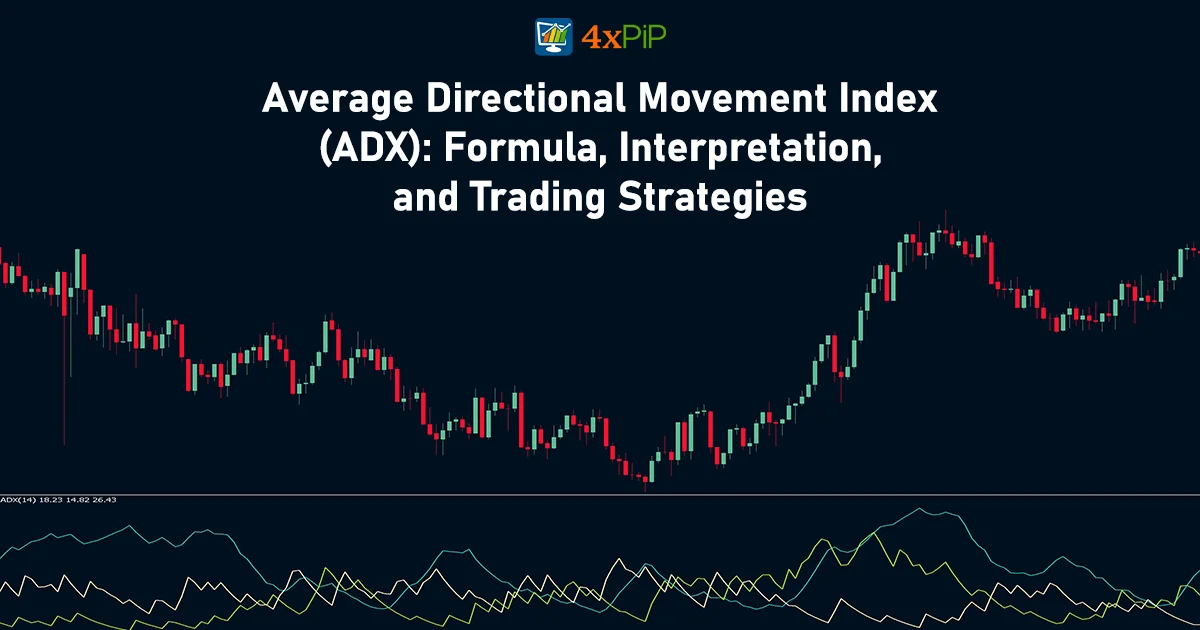
The Average Directional Movement Index (ADX) is a powerful technical indicator used by traders to determine the strength and direction of a trend. Developed by J. Welles Wilder Jr. in the late 1970s, the ADX indicator has become a popular tool in the world of technical analysis. It provides traders with valuable insights into the market, helping them make informed decisions and improve their trading strategies.
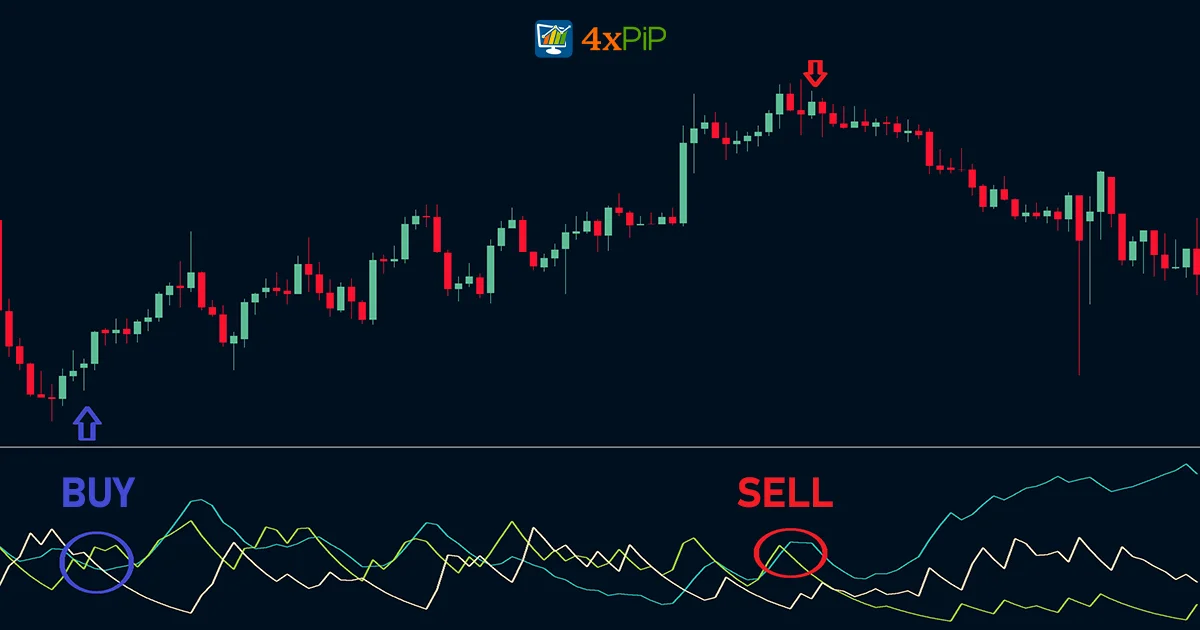
It consists of three lines: the ADX line, the +DI line, and the -DI line. Each line serves a specific purpose and provides valuable information to traders. The ADX line itself represents the strength of the trend. The higher the ADX value, the stronger the trend. The +DI line, also known as the positive directional indicator, measures the strength of the uptrend, while the -DI line, or the negative directional indicator, measures the strength of the downtrend.
Regarding indicators, 4xPip offers various options for different trading strategies and preferences. From momentum to volume-based indicators, we have diverse tools to help you analyze market trends and make informed trading decisions. Our customizable indicators allow you to adjust the parameters and settings to align with your trading style and preferences.
What is the Formula for the ADX Indicator?
The Average Directional Index (ADX) is calculated using a series of steps. Here’s the formula for ADX:
- Calculate +DM and -DM:
- +DM= High − Previous High if positive, otherwise 0
- −DM=Previous Low−Low if positive, otherwise 0
- If +DM > −DM, −DM=0, and vice versa.
Where DM = Directional Movement
- Smooth +DM and -DM over a specified period (commonly 14 periods)
- Smoothed +DM= 〈(Prior Smoothed +DM×13)+Current +DM〉/14
- Smoothed –DM = 〈(Prior Smoothed +DM×13)+Current –DM〉/14
- Calculate +DI and -DI
- +DI = 〈Smoothed +DM× 100〉/ADX
- –DI = 〈Smoothed –DM× 100〉/ADX
- Calculate Directional Movement (DX):
- DX = 〈Smoothed +DM – Smoothed -DM〉/〈Smoothed +DM + Smoothed -DM〉
- Calculate Average Directional Index(ADX):
- ADX = 〈(Prior ADX×13)+Current DX〉/〈specific period commonly 14〉
- To compute the Average Directional Index (ADX), extend the calculation of DX values over a minimum of 14 periods. Subsequently, employ smoothing techniques on these values to obtain the final ADX.
- The initial calculation for ADX involves summing the DX values throughout 14 periods and then dividing the total by 14.
- Following that step, the ADX is determined by taking 13 times the prior ADX, adding the current DX, and then dividing the sum by 14.
What Does the ADX indicator indicate?
Different ADX indicator levels have varying significance in the world of trading. Understanding these levels can help traders identify potential opportunities and manage risk effectively. Here are some key levels and their importance:
- ADX below 20: This level suggests the market is in a consolidation phase or downtrend, lacking a strong trend.
- ADX between 20 and 40: This range signifies that the market shows signs of a trend.
- ADX between 40 and 60: This range indicates a strong trend or uptrend in the market. Traders can confidently apply trend-following strategies and consider adding to their positions if the trend strengthens.
- ADX above 60: This level suggests a powerful trend, indicating that the market may be overbought or oversold.
Understanding the significance of different ADX indicator levels empowers traders to make more informed decisions and adapt their trading strategies to the prevailing market conditions. For those interested in automated trend-following strategies, 4xPip offers a range of Expert Advisors (EAs) built around the ADX indicator, helping you automate trade entries and exits based on trend strength.
How to use the ADX Indicator For Day Trading?
The best ADX indicator’s default setting is 14 periods, but traders can experiment with different settings to suit their trading strategies and preferences. While there is no one-size-fits-all approach, here are some general guidelines for selecting the best ADX settings:
- Short-term traders: Short-term traders focusing on day or swing trading may benefit from using a lower period setting, such as 7 or 10. This allows them to capture shorter-term trends and react quickly to market changes.
- Long-term traders: Long-term traders who aim to capture more significant trends and hold positions for an extended period may prefer a higher period setting, such as 20 or 30. This helps smooth out market noise and provides a more accurate depiction of the overall trend.
- Scalpers: Scalpers, who aim to profit from small price movements throughout the day, may find a very low period setting, such as 3 or 5, more suitable. This allows them to identify short-term trends and capitalize on quick price fluctuations.
Ultimately, traders should consider their trading style, time frame, and risk tolerance when selecting the best ADX settings.
Limitation of Average Directional Index (ADX):
While the ADX is a valuable tool for understanding trend strength, it’s essential to be aware of its limitations:
- ADX, based on moving averages, reacts slowly to price changes. This means it may signal trend strength after the actual trend has already begun, potentially leading to late entries or exits.
- ADX only measures trend strength, not direction. You need to use other indicators or technical analysis to determine if the trend is bullish or bearish.
- ADX can generate false signals, especially in choppy or sideways markets. These false signals can lead to unnecessary trades and potential losses.
Similar to other indicators, it is advisable to integrate the ADX with price analysis and other indicators. This combination aids in filtering signals and managing risk effectively.
Conclusion:
The ADX is a powerful tool for understanding the market’s momentum and making informed trading decisions. By understanding the formula, calculation, and interpretation of the ADX, traders can make more informed trading decisions and enhance their trading strategies. By deciphering the party’s vibe through ADX, you can analyze the financial markets more confidently and potentially score profitable moves.
Take control of your trading journey and unlock your full potential with 4xPip’s expert advisors and indicators. With 4xPip, you’ll be well-equipped to analyze the markets and achieve your trading goals. Don’t wait any longer – start maximizing your trading potential with 4xPip today.