As we delve into the dynamic world of gold trading, this analysis aims to unravel the intricacies of Gold (XAU/USD) prices on November 17, 2023. Globally, traders and investors are keenly observing the shifts in this precious metal’s value, seeking insights into the market dynamics that have influenced its performance. In this comprehensive analysis, we’ll explore the impact of economic indicators on gold prices, delve into the relationship between monetary policy outlook and gold’s trajectory, conduct a technical analysis of gold prices, discuss the future outlook for this commodity, and conclude with a summary and FAQs. For expert guidance and a range of trading tools, consider reaching out to 4xPip at [email protected].
Economic Indicators Impacting Gold Prices:
The surge in gold prices on November 17, 2023, was notably influenced by key economic indicators, primarily a retreat in U.S. Treasury yields triggered by disappointing labor market data. The number of applications for unemployment benefits exceeded expectations, indicating challenges in the employment landscape. Concurrently, continuing jobless claims reached a level not seen in nearly two years, hinting at growing struggles in the job market. Additionally, these lackluster employment indicators, although combined with positive Consumer Price Index (CPI) and Producer Price Index (PPI) figures, fostered a market sentiment suggesting a potential shift in the Federal Reserve’s stance toward rate cuts. Furthermore, this economic landscape, marked by uncertainties, propelled investors toward gold as a hedge.
Essentially, the economic indicators depicted a fragile economic recovery, prompting a reassessment of the Federal Reserve’s policy outlook. Additionally, the unexpected rise in unemployment claims and job market challenges hinted at a potential need for economic support. Moreover, coupled with positive inflation figures, this led to the expectation that the Federal Reserve might shift away from its recent tightening cycle and consider rate cuts. Investors, adjusting their expectations, contributed to a drop in U.S. Treasury yields; then, creating a favorable environment for the appreciation of gold prices. Understanding the intricate relationship between economic indicators and gold prices is vital for traders navigating the market’s complexities and making informed decisions based on prevailing economic conditions.
Monetary Policy Outlook and Gold’s Trajectory:
Dovish Shift in the Federal Reserve’s Stance: The recent rally in Gold (XAU/USD) prices on November 17, 2023, can be attributed to a notable shift in the Federal Reserve’s monetary policy outlook. Economic indicators, including disappointing labor market data, have contributed to a growing perception that the Fed’s tightening cycle is concluding.
Impact of Lackluster Economic Indicators: Worries about the U.S. labor market have grown due to weak economic performance, increased jobless claims, and rising unemployment benefit applications. Encouraging CPI and PPI figures fuel expectations of Federal Reserve rate cuts.
Expectations of Future Rate Cuts: The market sees economic indicators, hinting the Federal Reserve may cut rates. This dovish outlook lowers Treasury yields, lifting gold prices.
Gold as a Safe-Haven Asset: Gold flourishes in low-interest-rate environments and dovish monetary policies. It’s a safe-haven asset during economic uncertainty, attracting investors hedging against inflation and market volatility.
Potential Impact on the U.S. Dollar: The dovish shift in the Fed’s stance has also influenced the U.S. dollar’s performance. A corrective decline in the U.S. dollar has further supported the rise in gold prices, as a weaker dollar makes gold more attractive to international investors.
Contingency on Economic Data: The future trajectory of gold prices will likely remain contingent on incoming economic data. Any indication of further weakness in the U.S. economy could accelerate the Federal Reserve’s dovish pivot, sustaining the upward momentum in gold prices.
Gold Price Technical Analysis:
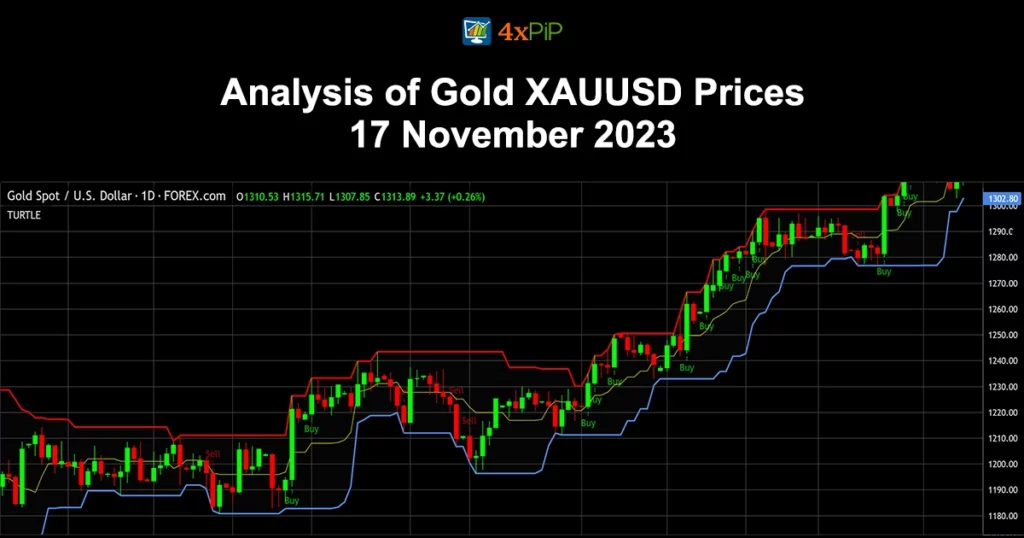
On November 17, 2023, gold prices, measured through futures contracts, witnessed a substantial rally. Additionally, this rally was marked by a noteworthy breakout above a crucial technical resistance level ranging from $1,975 to $1,980. Moreover, this breakthrough holds significant implications for traders and investors, guiding their strategies in the days to come. Let’s delve into the technical intricacies shaping the current and potential future movements of gold prices.
Breakout and Consolidation:
The breakout above the $1,975-$1,980 resistance zone signifies a bullish surge in the market. If sustained, this breakout could pave the way for a period of consolidation to the upside. Traders will closely watch for confirmation of this consolidation phase, as it could set the stage for further upward momentum.
Upside Targets:
With the successful breach of the resistance zone, attention shifts to potential upside targets. In this context, prices might target the $2,010/$2,015 range in the coming days. This marks a crucial level where additional gains could embolden the bullish camp, potentially leading to an assault on the $2,060 level.
Bearish Reversal and Support Levels:
Despite the bullish momentum, it’s essential to acknowledge the possibility of a bearish reversal. If a downturn occurs, the commodity has its initial line of defense against a deeper retracement in the $1,980-$1,975 zone. This area, which previously resisted movement, could now function as support, potentially establishing a base for the commodity.
Deeper Retracement Scenarios:
However, caution is warranted. A breakdown below the $1,980-$1,975 zone might trigger a more profound retracement. The $1,950/$1,940 range becomes a critical area to watch, as it hosts the convergence of several key moving averages. A breach of this support cluster could intensify selling pressure, with the next focus point being the $1,920 level.
Importance of $2,060 Level:
Looking ahead, the $2,060 level emerges as a key threshold. If prices continue their upward trajectory and successfully challenge this resistance, it could signify a significant shift in market dynamics. Bulls may interpret this breach as a signal to pursue further gains, potentially influencing the broader sentiment in the gold market.
Future Outlook:
In conclusion, our exploration of Gold (XAU/USD) prices on November 17, 2023, indicates that the market is responding to a combination of economic signals, shifts in Federal Reserve policy, and geopolitical events. The recent breakout signals potential upward movement, with traders eyeing the $2,010/$2,015 range as a significant level. The Federal Reserve’s dovish stance, hinting at future rate cuts, shapes the current narrative, emphasizing the importance of staying alert to economic indicators.
Peering into the future, vigilance remains key. Additionally, economic indicators, especially those tied to the labor market and inflation, will continue to shape market sentiment. Furthermore, within the domain of technical analysis, there is a pronounced emphasis on crucial support and resistance levels. Again, this is particularly notable, with focused attention on the pivotal $2,060 mark, delivering strategic insights.
The road ahead for gold prices intertwines with economic data, Federal Reserve decisions, and geopolitical shifts, making it crucial for traders to adapt and seize potential opportunities.
In the dynamic precious metal trading landscape, stay informed, align with market dynamics, and position yourself wisely. Gold’s allure as a safe haven enhances its appeal during uncertain times. Stay attuned to changing market tides and strategically position yourself.
Summary:
On November 17, 2023, we analyzed Gold (XAU/USD) prices, exploring factors affecting its performance, including a surge triggered by disappointing labor data and dovish signals from the Federal Reserve. Traders rely on economic indicators, a dovish monetary policy outlook, and technical analysis to navigate potential targets and support levels. The future outlook emphasizes the importance of economic data, Fed decisions, and geopolitical shifts, urging vigilance and strategic positioning. This comprehensive overview equips investors with insights into navigating the ever-evolving landscape of gold trading.