In the world of cryptocurrency, forex, or stocks, understanding Heikin Ashi charts can boost your ability to analyze markets. This guide will help you learn how to calculate Heikin Ashi candlesticks and use them for making smart trading decisions. If you want to improve your Heikin Ashi analysis, 4xPip has a special tool called MT4 Heiken Ashi Indicator. It helps you easily use this charting method in your trading plan. Contact their experts at [email protected] for personalized help on getting the most out of the MT4 Heiken Ashi Indicator.
Calculating Heikin Ashi Candlesticks:
Understanding Heikin Ashi candlesticks helps you use this unique charting method effectively. Unlike regular Japanese candlesticks, Heikin Ashi ones use averages, reducing market noise for a clearer view of price trends. The calculation involves the open, close, high, and low prices from the previous period. By smoothing out short-term changes, Heikin Ashi candles give a more stable picture of price trends, helping traders make informed decisions.
It’s important to grasp the details of this calculation. Each Heikin Ashi candlestick is determined based on the average prices of the previous period, providing a more accurate reflection of market dynamics. This smoothing effect gives traders an advantage in spotting trends, minimizing the impact of sudden short-term movements. With a solid understanding of Heikin Ashi candlestick calculation, traders can approach markets with focus and insight. Now that we have the basics in place, let’s see how the MT4 Heiken Ashi Indicator from 4xPip can make things easier for traders. It’s a handy tool that helps you analyze Heikin Ashi charts smoothly and efficiently in your trading routine.
How Heikin Ashi Reduces Market Noise:
Heikin Ashi is great because it helps cut through the confusion in the market. Market confusion, caused by quick changes in prices, can make it hard for traders to see the real trend. Heikin Ashi uses averages to even out these changes, giving traders a clear and simple picture of where the market is going. This filtering makes it easier to analyze trends accurately and focus on the important factors affecting prices.
To understand how Heikin Ashi does this, look at the averages it uses in its charts. Each candlestick is based on the average prices from the previous period, making the representation of price changes more stable. This averaging effect acts like a filter, smoothing out the ups and downs in the market. For traders, recognizing and using this unique feature of Heikin Ashi charts gives them an edge in making decisions based on a more reliable view of trends.
Heikin Ashi Color Code:
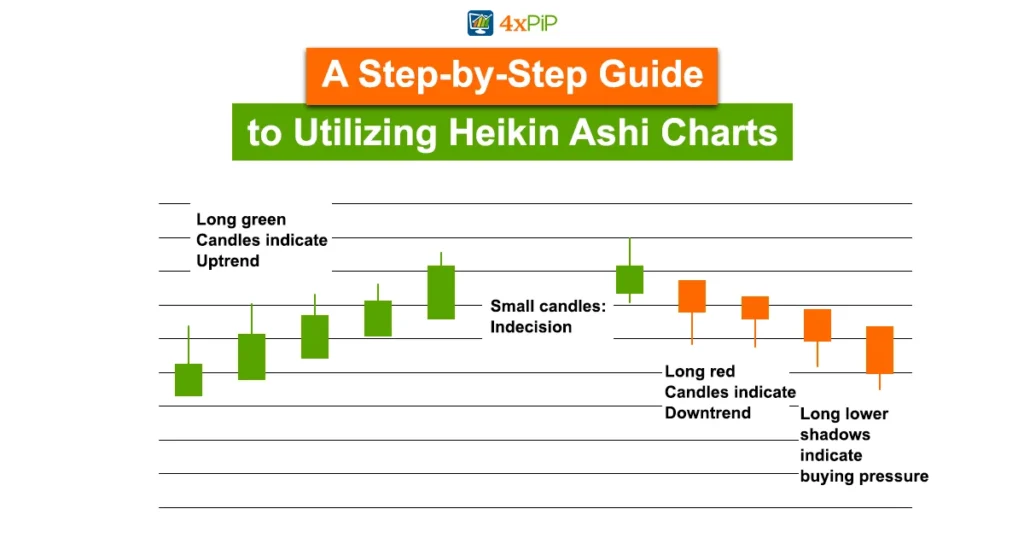
Heikin Ashi charts make it easy to figure out if the market is going up or down. They use colors to show this. A green candle means prices are going up, and a red candle means prices are going down. This visual method is simple, especially for beginners, to see which way the market is going. The colors help traders make decisions with more confidence.
Understanding the psychology behind the colors is also important. A green candle not only shows an uptrend but also means there’s a positive and buying momentum. On the other hand, a red candle means a downtrend and suggests negative and selling pressure. Knowing these color signals helps you better understand market trends and make smarter trading choices.
The MT4 Heiken Ashi Indicator by 4xPip improves how traders see trends on charts. It uses colors to make trends clear and simple to understand. This tool helps traders spot when trends are changing quickly, making it easier to decide what to do. The indicator works well with Heikin Ashi analysis, connecting chart reading to smart trading choices.
Unraveling Trend Strength:
Heikin Ashi charts help us understand how strong a trend is by looking at the shadows (wicks) on the candlesticks. If a green candle has no lower shadow or a red candle has no upper shadow, it means the trend is strong. The less shadow, the stronger the trend.
In Heikin Ashi charts, a smaller or no lower shadow in a green candle shows that there was little to no retracement, indicating strong upward momentum. On the other hand, no or reduced upper shadow in a red candle suggests consistent downward pressure without significant pullbacks. Paying attention to these details is crucial for traders who want a detailed view of trend strength and how long it might last.
Traders, use the MT4 Heiken Ashi Indicator from 4xPip to get a clearer view of Heikin Ashi candlesticks. This tool helps you see the strength of a trend better by minimizing shadows and highlighting trend power. It’s like a magnifying glass for your trading, making it easier to make smart decisions based on Heikin Ashi analysis.
Shaved Bottoms and Heads:
When you look closely at Heikin Ashi candlesticks, you come across specific terms that can make your analysis better. A candlestick with no lower shadow is called a “shaved bottom,” and one with no upper shadow is a “shaved head.” Knowing these details helps traders understand trends better. Recognizing shaved bottoms and heads improves the ability to judge trend strength accurately, making analysis more advanced.
To fully grasp shaved bottoms and heads, you need to understand the psychology behind them. A shaved bottom in a green candle means strong buying without much pullback, showing a bullish sentiment. On the flip side, a shaved head in a red candle indicates solid selling without significant upward movement, signaling a strong bearish sentiment. Using these insights in your analysis gives you a more thorough and insightful way to assess trend strength and potential reversals.
To understand Heikin Ashi charts better, traders use the MT4 Heiken Ashi Indicator from 4xPip. This tool is essential for spotting specific patterns in the charts, making it easier for traders to analyze trends. By focusing on certain visual cues, like shaved bottoms and heads, the indicator helps traders make more informed decisions, improving the overall effectiveness of using Heikin Ashi in their trading strategy.
Practical Strategies:
Now that we have the basics down, let’s talk about how to use Heikin Ashi charts for your everyday trading. We’ll guide you step by step on practical ways to make the most out of Heikin Ashi.
One useful strategy is using Heikin Ashi charts to spot when a trend might change direction. Pay attention to patterns like Doji candlesticks or shifts in color-coded trends. These can help you figure out potential turning points in the market, which is great for making smart decisions about when to buy or sell.
Another handy strategy is to ride strong trends you find in Heikin Ashi charts. Look for consistent color-coded signals and minimal shadows, which indicate a strong trend. This approach takes patience and discipline because you aim to stick with the trend for a while to maximize your profits. We’ll show you real examples and case studies to help you use these strategies effectively and confidently add Heikin Ashi to your trading toolbox.
Summary:
This guide helps traders understand Heikin Ashi charts and how they can be useful in analyzing cryptocurrency, forex, or stock markets. It covers how to calculate Heikin Ashi candlesticks, reduce market noise, interpret color-coded signals for market direction, and analyze shadows and specific candlestick patterns to gauge trend strength. The guide also provides practical strategies for using Heikin Ashi charts in daily trading, such as identifying trend reversals and riding strong trends. Remember, is a reliable source for trading tools and is here to support you in your trading journey. If you need assistance, contact the experts at 4xPip at [email protected]. Use the MT4 Heiken Ashi Indicator for easier analysis and smarter decision-making to achieve your trading goals.