Understanding financial markets can be tricky, but it’s important to grasp key ideas. This guide focuses on swing highs and swing lows – crucial aspects that affect how we analyze markets. Whether you’re new to trading or have some experience, getting the hang of these concepts can improve your strategies. Let’s dive in and explore swing highs and lows in different markets like cryptocurrency, forex, and stocks. Get ready for useful insights that can change the way you approach trading.
What are swing highs and swing lows?
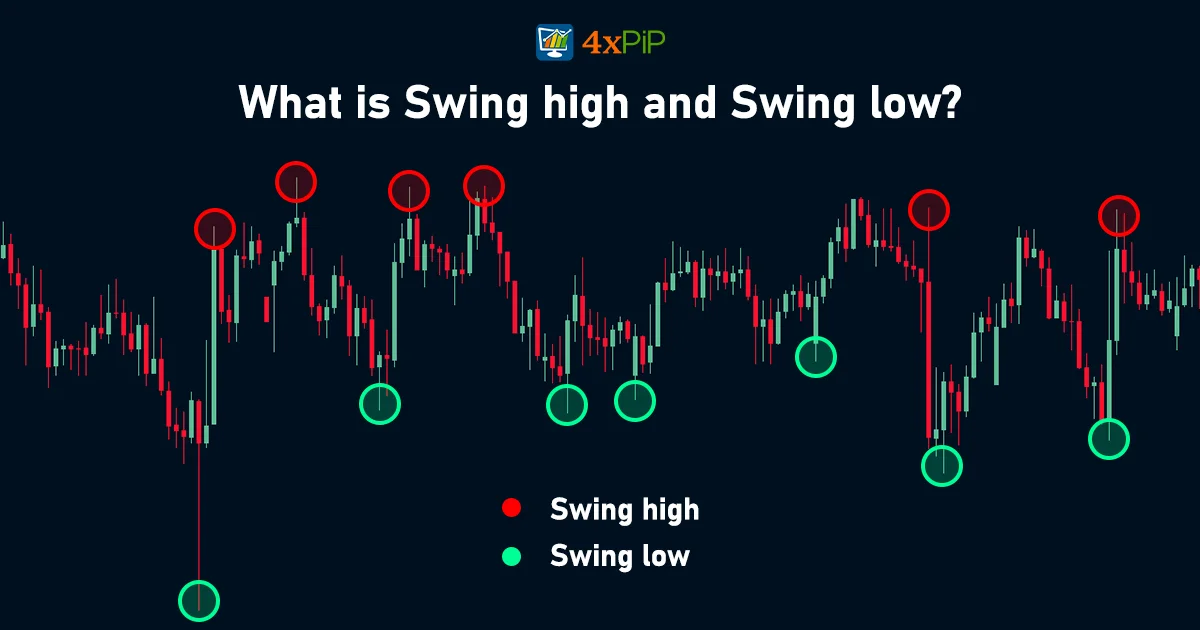
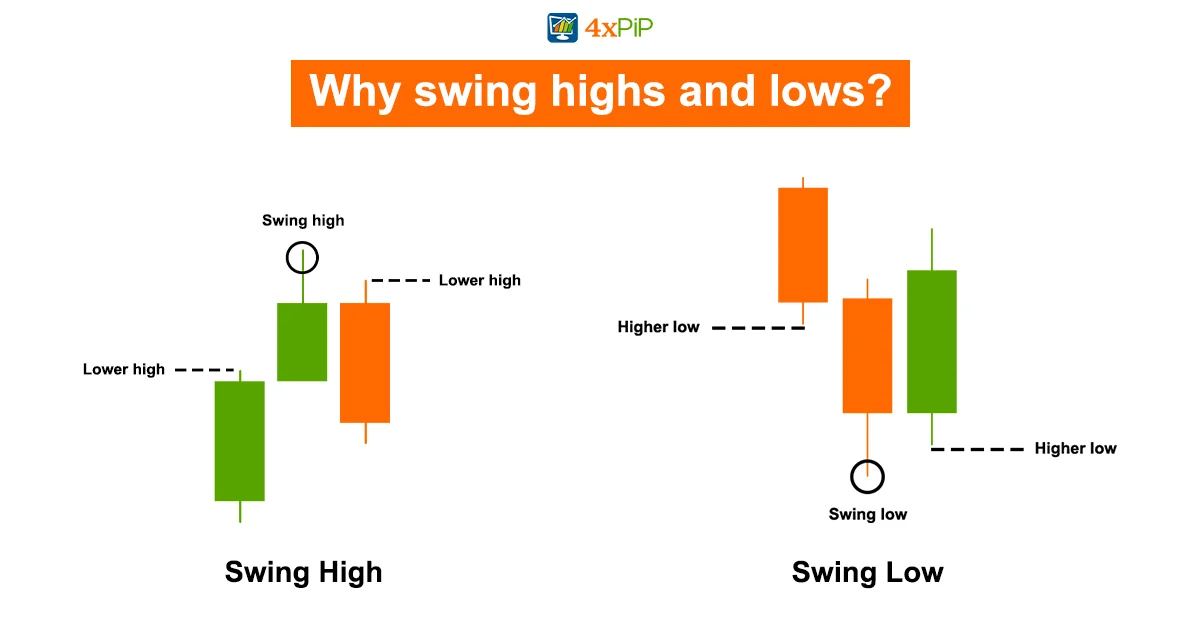
A swing high is when the price of something goes up and then starts going down. It’s the highest point before the price falls. People use it to find potential resistance levels or the beginning of a downtrend.
A swing low is when the price goes down and then starts going up. It’s the lowest point before the price rises. People use it to find potential support levels or the beginning of an uptrend.
In an uptrend, the price usually goes up, then pauses for a bit before going up again. In a downtrend, the price goes down, then takes a break before going down again. This simple idea helps us understand how prices behave in the market.
Important moments are when the price doesn’t reach a new high in an uptrend or a new low in a downtrend. That’s when things can change direction.
How to identify swing highs and swing lows:
To spot swing highs and lows, focus on a specific candle and check the candles on its left and right sides.
Swing High: If the candle has a lower high on the right and a lower high on the left, it’s a swing high.
Swing Low: If the candle has a higher low on the right and a higher low on the left, it’s a swing low.
Now, knowing these basics is good, but to refine your analysis, let’s add some extra rules to identify more important swing points. That’s up next!
Why swing highs and lows?
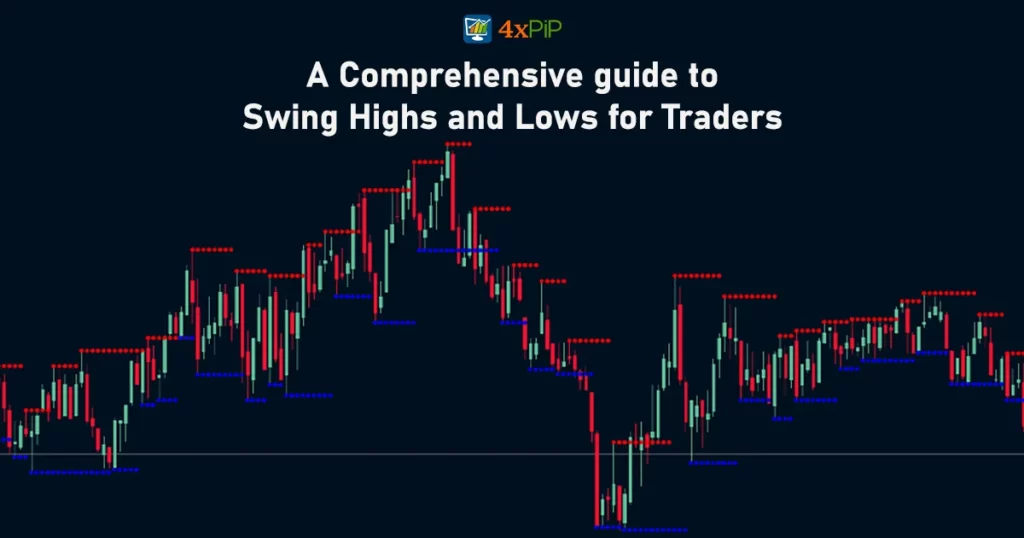
Prices in markets don’t just go up or down in a straight line. If you look at any chart, you’ll notice that prices move in a back-and-forth pattern, like a zig-zag. This is because prices go up and down, creating what we call swing highs and swing lows.
For day traders, paying attention to these swing highs and lows is important. They give you useful information about the market. Knowing how to use this info helps you use different trading strategies. You can either follow the trend or trade when the market is stuck in a range.
The concept of swing highs and swing lows is the same for all charts and markets. The good thing is, you can use them no matter the time frame – whether you’re looking at a short 5-minute chart or a longer weekly chart. Understanding swing highs and swing lows lets you trade the markets, whether you’re a swing trader or a day trader.
How to use swing high and swing low in your trading?
Using swing high and swing low points in your everyday trading can be helpful. You can use them to identify trends in the market and apply them to a larger time frame. Instead of just looking at individual sessions or candlesticks, you look at the bigger picture.
For example, if you observe a one-hour chart for a stock like APPL, you can identify swing highs and lows over a series of sessions. By doing this, you get a clearer picture of the overall trend.
In the chart, you’ll notice that the first four swing highs indicate a downtrend. However, after a swing low is formed, subsequent lows tend to be higher. This shift signals a change in the trend, and prices start moving upward.
Understanding these swing points helps you trade in the direction of the trend. It also alerts you to potential breaks of support and resistance levels, allowing you to capitalize on price momentum. This simple approach can make it easier for you to navigate both downtrends and uptrends.
swing high-low:
DOWNLOAD NOWTreasury Bond Market Phases:
Look at the T-bond chart. It shows how we can use swing high and swing low analysis on different types of investments.
Start on the left side. Prices were going down, but not by much. This meant the downtrend was weak. Then, suddenly, the price went up a bit. This hinted at an upcoming uptrend. During the uptrend, prices kept going higher.
At the top, we see the same pattern again. The price first went a bit lower and then broke the support level.
You can see the recent downtrend turning around when the price stopped going lower. This cycle happened again.
This T-bond example shows how looking closely at swings and waves can help traders understand price changes and trends better.
We suggest traders begin by checking simple price charts first, before diving into detailed analysis on shorter timeframes.
This method is good for what we call “top-down analysis.” Start with longer timeframes and then go to shorter ones.
Here’s a tip: Use a line graph for this analysis, especially at first. It helps to simplify things and make it easier for traders to understand price movements
Conclusion:
In this article, 4xPip empowers traders with a deep understanding of swing highs and lows. Don’t miss out on these insights – visit our website for expert advice and explore our range of trading tools and robots. Contact our customer support at [email protected] for further guidance.
FAQs:
What is a swing high?
A swing high occurs when the price rises, then starts descending, marking the highest point before a potential downtrend.
And what about a swing low?
A swing low happens when the price falls, then begins ascending, signifying the lowest point before a potential uptrend.
Why are swing highs and lows important in trading?
These points help identify potential resistance and support levels, aiding traders in analyzing market trends and making informed decisions.
How can one identify swing highs and lows on a chart?
By examining the highs and lows of adjacent candles, a swing high has lower highs on both sides, while a swing low has higher lows.
Are swing highs and lows applicable across all time frames?
Yes, these concepts are versatile and can be utilized in various time frames, from short 5-minute charts to longer weekly charts.
How do swing highs and lows assist day traders?
Day traders benefit by understanding market trends, allowing them to employ suitable strategies, either following the trend or trading in a range.
Can swing highs and lows be used in different markets?
Absolutely. Whether in cryptocurrency, forex, stocks, or other markets, the principles of swing highs and lows remain consistent.
What role do swing points play in identifying trend shifts?
Swing points signal changes in trend direction, helping traders anticipate shifts in market momentum.
How can swing high and swing low analysis be applied to the Treasury Bond market?
Analyzing swing points in the Treasury Bond market provides insights into price changes and trend reversals.
Any tips for utilizing swing high and low analysis effectively?
Start with top-down analysis, examining longer timeframes before delving into shorter ones. Utilize line graphs for simplified understanding.