In the ever-evolving landscape of trading, understanding technical analysis is extremely important. In this blog, we’ll look into the intriguing realm of Triple Tops and Bottoms, exploring their significance and how they can be used for informed trading decisions. At 4xPip, a reliable source for trading tools, we’re committed to empowering traders with essential knowledge. For more guidance and insights, reach out to our experts at [email protected].
Triple Tops:
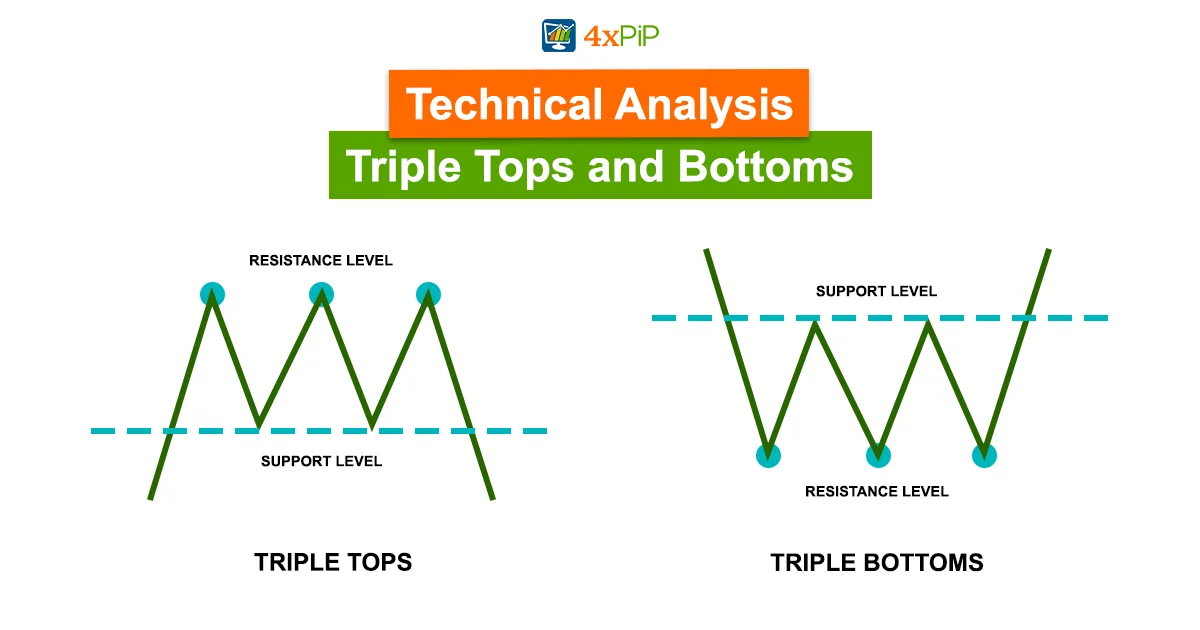
Imagine the market as a battleground between buyers and sellers. Triple Tops are like three battle attempts where the price, representing the buyers, tries but fails to go beyond a certain point, the resistance level. This pattern usually shows up after a series of upward movements, signaling potential trouble for the prevailing positive trend. Visually, it creates three distinctive peaks on the price chart, emphasizing the struggle to surpass a specific price. Triple Tops are like a red flag, suggesting that the previously optimistic atmosphere might be turning a bit pessimistic.
For traders eyeing Triple Tops, it’s crucial to wait for confirmation. After the three peaks are in place, attention shifts to the support level, a sort of safety line for the price. Confirmation happens when the price drops below this support, indicating that a shift to a potential downtrend might be underway. This confirmation is like a green light for traders, a signal to consider adjusting their strategies or positions. Additionally, traders often estimate how far the price might drop by measuring the distance from the peaks to the support level. It’s a bit like predicting the possible fallout of the pattern. As with any tool in trading, combining Triple Tops with other indicators can provide a more comprehensive understanding, like having multiple lenses to view the market.
Key Points:
Formation Confirmation: Spotting three consecutive peaks is the starting point.
Support Breakdown: Confirmation comes when the price falls below the established support level.
Bearish Sentiment: Indicates a shift from a positive to a negative market vibe.
Projected Price Decline: Traders often estimate a downward move based on the distance from the peaks to the support level.
Strategic Incorporation: Using Triple Tops works better when combined with other indicators and analysis methods, providing a more complete picture of the market
Triple Bottoms:
Triple Bottoms, a crucial pattern in technical analysis, unfolds after a prolonged downtrend. In this formation, the price reaches a trough three times, and each time, it fails to break below a significant support level. This pattern signals a potential shift in market sentiment from bearish to bullish. Imagine a scenario where a stock has been experiencing a consistent decline in its value. With each attempt to push the price lower, it rebounds from a specific support level, forming a series of three troughs. This failure to breach the support level indicates that the selling pressure is diminishing, setting the stage for a potential reversal in the prevailing downtrend.
Traders keen on identifying trend reversals often use Triple Bottoms as a key indicator. The pattern becomes confirmed when the price surpasses the resistance level, marking the beginning of an upward move. This breach of resistance indicates a shift from bearish sentiment to bullish optimism. Traders can then project an upward price movement equivalent to the distance from the troughs to the resistance level, helping set potential profit targets. Recognizing and understanding Triple Bottoms is an essential skill for traders seeking opportunities in trend reversal scenarios.
Key Points:
Trend Reversal Signal: Triple Bottoms serves as a potent signal for the potential end of a downtrend, making them invaluable for traders looking to capitalize on trend reversals.
Resistance Breakout: Confirmation of the pattern occurs when the price surpasses the resistance level, signaling a shift from bearish to bullish sentiment.
Target Projection: Traders often project an upward price move equivalent to the distance from the troughs to the resistance level to set potential profit targets.
Market Sentiment Shift: The failure to break below the support level indicates diminishing bearish momentum, setting the stage for a change in market sentiment.
Application Across Markets: Triple Bottoms are applicable not only in stock markets but also in various financial markets, including forex and cryptocurrencies. Traders can leverage this pattern’s reliability across different assets for trend reversal opportunities.
Volatility and Duration:
Volatility and duration play a pivotal role in the reliability and effectiveness of Triple Tops and Bottoms, crucial patterns in technical analysis. Let’s break down these elements for a clearer understanding:
Volatility:
Volatility refers to the degree of variation in the price of a financial instrument over a specific period. In the context of Triple Tops and Bottoms, understanding volatility is like assessing the rhythm of market movements. Here’s why it matters:
Pattern Formation Speed: High volatility can lead to a rapid and unpredictable formation of Triple Tops and Bottoms. Prices may swing widely, making it challenging to pinpoint the exact pattern.
Pattern Reliability: On the flip side, low volatility might result in a slow and gradual pattern formation. While this might offer a clearer picture, extremely low volatility could make the pattern less reliable.
Understanding the volatility of the market during the pattern formation is critical. Ideally, a moderate level of volatility provides a balance, allowing for a discernible pattern without excessive unpredictability.
Duration:
Duration, in the context of Triple Tops and Bottoms, measures the time it takes for a pattern to complete its formation. The timeframe during which the pattern develops is crucial for traders. Here’s why duration matters:
Pattern Strength: A pattern that forms over a reasonable duration is generally considered more robust. It suggests that market forces are consistently interacting within a specific range.
Confirmation Stability: A longer duration often leads to a more stable confirmation when the price breaks above or below the key levels. This stability enhances the trader’s confidence in the pattern.
However, there’s a balancing act. A pattern forming too slowly might lose its relevance, while one forming too quickly might lack the necessary confirmation stability. Traders need to gauge the right duration based on the market’s characteristics and the chosen time frame.
In conclusion, when navigating the world of Triple Tops and Bottoms, striking the right balance between volatility and duration is key. Monitoring these factors helps traders assess the reliability of patterns and make more informed decisions. It’s not just about spotting the pattern but understanding the conditions under which it forms, ensuring a comprehensive approach to technical analysis.
Volatility and Volume in Price Patterns:
Understanding the intricate dance between volatility and volume is paramount in the world of trading, particularly when examining price patterns like Triple Tops and Bottoms. Volatility refers to the extent of variation in the price of an asset over a specific timeframe. It acts as a measure of market uncertainty and can significantly influence the reliability of pattern formations. Patterns forming in periods of low volatility might progress slowly, offering traders a more extended window to recognize and act on potential reversals. On the other hand, high volatility can lead to rapid and unpredictable pattern formations, requiring traders to be vigilant and responsive.
Moreover, the duration of pattern development plays a crucial role in its strength and reliability. A pattern formed over a short period might be more susceptible to the influence of random market movements, potentially resulting in false signals. On the contrary, a pattern evolving over a more extended duration tends to be more robust and reflective of sustained market sentiment. Recognizing the delicate balance between volatility and duration is an art in itself, demanding traders to adapt their strategies based on the prevailing market conditions.
When delving into the world of Triple Tops and Bottoms, the role of volume cannot be overstated. Volume, representing the number of shares or contracts traded during a specific period, acts as a corroborating factor for the strength of a price pattern. High volume during the formation of these patterns serves as a vote of confidence, validating the potential trend reversal. It signifies active market participation, indicating that the pattern’s development is supported by substantial trading activity. Conversely, low volume during pattern formation may signal a lack of conviction among market participants, casting doubt on the pattern’s reliability.
Summary:
In this blog, we’ve delved into the world of Triple Tops and Bottoms, shedding light on their role in predicting shifts in market trends. The guide walks traders through the identification and confirmation of these patterns, emphasizing projection techniques. The nuanced relationship between volatility, duration, and volume is explored, showcasing their impact on the reliability of these patterns. For traders navigating the complexities of the market, this comprehensive guide offers practical insights to make informed decisions in their trading journey.


