Price charts can be just as bumpy in the trading world, with constant ups and downs that obscure the underlying trend. This is where moving averages come in, acting like your car’s suspension system, smoothing out the noise and giving you a clearer view of the road ahead. This article by 4xPip gives you a comparison between moving averages that provides better insight into Simple Moving Averages (SMA) and Exponential Moving Average (EMA). So, let’s dive into the river of moving averages with 4xPip!
What is the Moving Average in Trading?
A Moving Average (MA) is simply a calculated line that shows the average price of a security or asset over a specific period. It takes the data points from that period, adds them up, and then divides them by the number of points. Think of it like taking the average height of everyone in a room – some might be tall, some short, but the average gives you a general idea of everyone’s stature.
The 4xPip MT4 Multicolor MA Indicator is an exceptionally advanced and custom trading indicator with precise trend predictions. Developed on the foundation of the Moving Average strategy, this indicator empowers traders by automating their trading approaches, simplifying the identification and execution of trades based on market trends.
There are different types of moving averages, but 4xPip has you covered with the two most popular ones: the Simple Moving Average (SMA) and the Exponential Moving Average (EMA).
Understanding Simple Moving Average (SMA):
The Simple Moving Average (SMA) is a crucial tool in technical analysis, offering traders insights into prevailing trends and aiding in decision-making. Calculated by averaging prices over a specified period, SMA provides a smoothed trend line that is easy to interpret.
The formula for SMA is straightforward:
SMA= P₁+P₂+…+Pn /n
Where:
- P₁, P₂,…, Pn are the closing prices over ‘n’ periods.
- ‘n’ is the number of periods.
SMA helps identify trends, making it a valuable tool for traders. When prices are above the SMA, it indicates an uptrend, while prices below suggest a downtrend. Crossovers between short-term and long-term SMAs generate signals. Bullish signals occur when the short-term SMA crosses above the long-term SMA, and vice versa for bearish signals. As a versatile and practical indicator, the SMA is a valuable ally for traders seeking to analyze the complexities of financial markets with clarity and precision.
Understanding Exponential Moving Average (EMA):
The Exponential Moving Average (EMA) is a dynamic and responsive technical analysis tool designed to provide traders with insights into evolving market trends. Calculated using a weighted formula, the EMA emphasizes recent prices more, making it particularly effective for short-term analysis.
The formula for EMA involves a weighted calculation that prioritizes recent prices:
EMAt = (Closet−EMAt−1) × Multiplier + EMAt−1
where,
- EMAt is the EMA value at time t.
- Closet is the closing price of the asset or security at time t.
- EMAt−1 is the EMA value at the previous time period.
- The Multiplier is calculated based on the chosen time period.
The Multiplier is calculated using the formula:
Multiplier = 2/N+1
- Where N is the chosen time period.
EMA reacts swiftly to changes in price, making it ideal for short-term traders and dynamic market conditions. Similar to SMA, EMA helps identify trends, but with a focus on recent price movements. Where short-term and long-term EMAs intersect, EMA crossovers generate signals for potential trend reversals or continuations.
Prices above the EMA signal a positive trend (bullish), and traders may consider buying opportunities. Prices below the EMA indicate a negative trend (bearish), presenting potential selling opportunities. EMA empowers traders to navigate short-term market dynamics with precision and confidence.
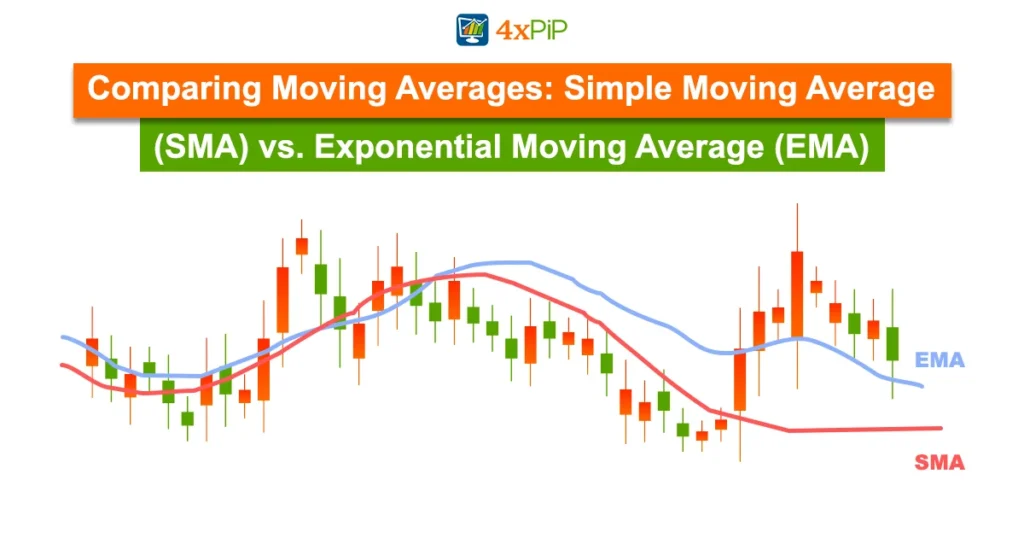
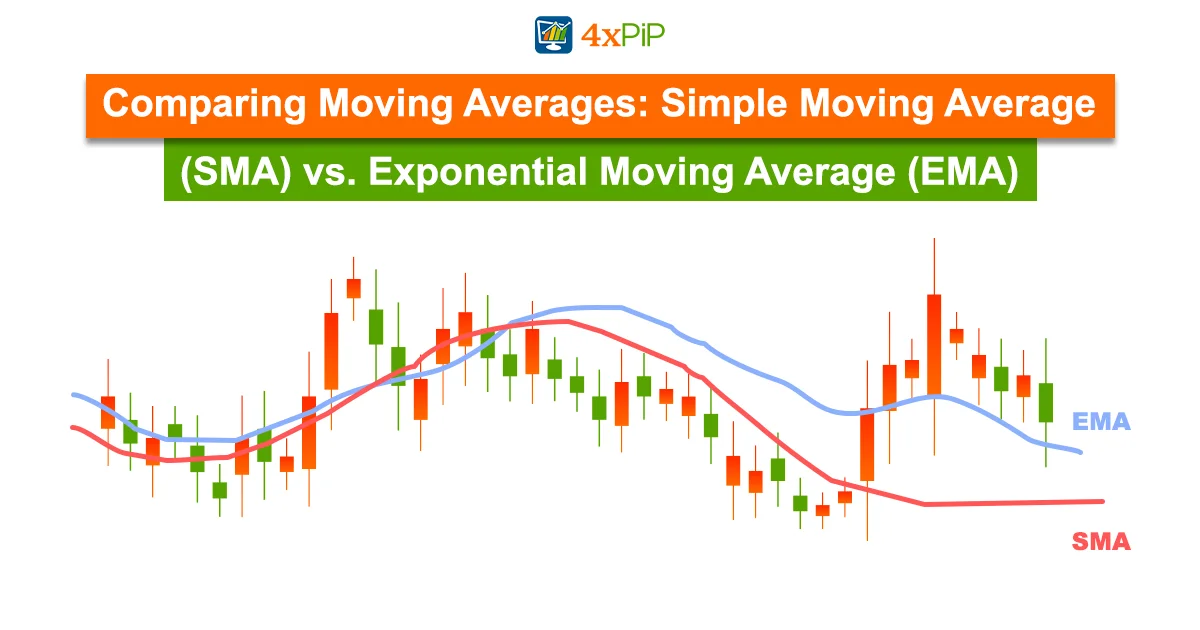
Head-to-Head Comparison of SMA and EMA:
The critical difference lies in their calculation methods when comparing SMA and EMA. While SMA treats all data points equally, and EMA places more emphasis on recent prices. Consequently, the EMA reacts more swiftly to price changes, making it preferred for traders who focus on short-term trends. On the other hand, SMA provides a smoother curve and is often favored for longer-term analysis.
|
Feature |
SMA |
EMA |
|
Sensitivity |
Low |
High |
|
Lag |
More |
Less |
|
Best for |
Long-term trends, support/resistance levels |
Short-term trends, trend reversals |
Pros and Cons of SMA and EMA:
Simple Moving Average (SMA):
|
Pros: |
Cons: |
|
Offers a clear and steady representation of long-term trends.
|
Slower to adapt to rapid price changes. |
|
Less prone to reacting to short-term market noise.
|
May lag behind current market conditions |
Exponential Moving Average (EMA):
|
Pros: |
Cons: |
|
Reacts quickly to recent price movements.
|
More susceptible to market noise.
|
|
It is ideal for short-term traders and dynamic market conditions.
|
It may generate false signals in choppy or sideways markets.
|
How to Choose the Best Moving Average?
Choosing between SMA and EMA depends on your trading strategy and time horizon. SMA may be more suitable for its stability if you’re a long-term investor. For short-term traders, EMA’s responsiveness can be advantageous. Moreover, experimenting with both types and analyzing their performance in different market conditions can help you determine the best fit for your trading style. You can even use both together! Experiment with other moving averages and periods to find what works best. With 4xPip and the power of moving averages, you can confidently conquer those bumpy markets! And remember, the road to trading success is paved with patience, practice, and a little bit of chart smoothing.
Conclusion:
Whether cruising with the stability of SMA or analyzing swiftly with the responsiveness of EMA, traders can conquer the markets with patience, practice, and the power of chart smoothing. As the road to trading success unfolds, moving averages stand as reliable companions, helping traders analyze trends and make strategic decisions with clarity. With 4xPip as your guide, the journey through the river of moving averages becomes an informed and confident experience.
4xPip is your partner in trading success. Furthermore, we offer a wide range of indicators and EAs designed to work seamlessly with both SMAs and EMAs. Explore our library and find the perfect tools to complement your moving averages.